


Can Apollo Become a New Berkshire? A New Era of Insurance-Driven Investing.
In the race for relentless compounding


“Here come the Berkshire Hathaway Wannabes” is an article I recently stumbled upon in Barron’s. It is about who will combine insurance and investments most successfully in a Buffett-like fashion. In numbers, it means compounding at ~20% over ~60 years.
Several new candidates have recently joined the race, including hedgies Bill Ackman and Dan Loeb. Of the more seasoned candidates listed in the article, I own and have covered two: Fairfax Financial (FRFHF in the US, FFH in Canada) and Apollo Global (APO). So far, Fairfax has delivered 18.3% IRR over 40 years. Apollo was publicly launched on March 30, 2011, at prices between $17 and $19. Assuming an average of $18, APO has delivered 14.6% in price appreciation alone. APO’s dividend yield on average was ~5-6%% until it merged with Athene on Jan 1, 2022, which makes the total IRR close to 20% over 11 years. Apollo’s track record, combined with its innovative current strategy, makes it a strong contender to become the next Berkshire Hathaway.
This article attempts to better value Apollo. In particular, I am interested in whether now is the right time to add to my Apollo holdings. The company keeps growing its business briskly, but has lost about 19% YTD in sync with other alternative managers. I will assume you are familiar with the company. If not, please check Apollo’s posts on my author’s page.
Traditional SOTP
I have to start by repeating myself. Apollo consists of life insurer Athene, which produces spread-related income (“SRE”), the alternative manager, which produces fee-related income (“FRE”), and the Principal Investing Income segment (“PII”), which is mostly carry. Income from the three segments, less holdco and financing costs, comprises the so-called Adjusted Net Income (ANI), which is a non-GAAP metric everybody uses.
PII is much smaller than SRE or FRE and deserves lower multiples, as it fluctuates wildly depending on Apollo’s ability to sell its portfolio companies. When the market is favorable, PII may become significant. In other years, it is small. However, even in bad years, PII is bigger than holdco costs, and we can discard both to simplify our valuation. Our model’s ANI will always be smaller than the ANI reported by Apollo. We think it is acceptable, as Apollo is focused on growing FRE and SRE.
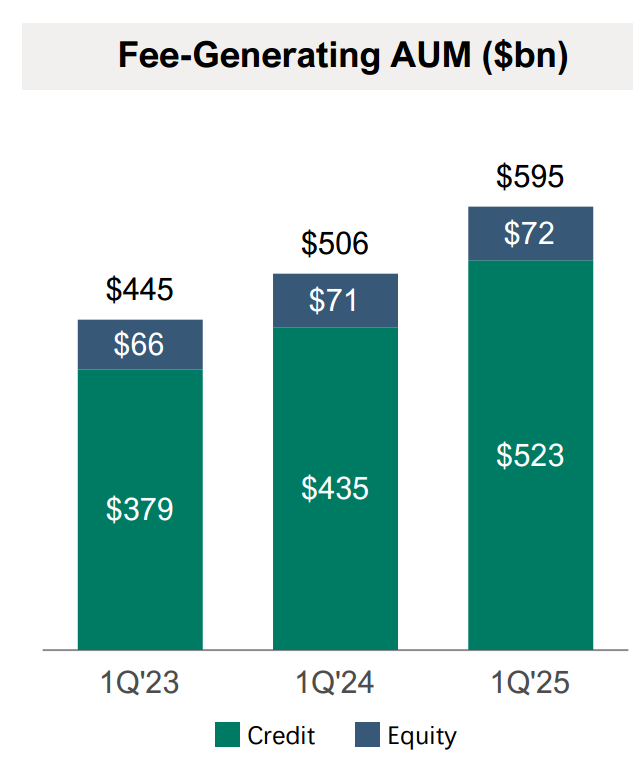
The PII segment earns income from a portion of equity FGAUM (fee-generating AUM). Its declining importance is clear in the slide below—equity FGAUM grows slowly, while credit FGAUM is rising sharply. Moreover, because of lower multiples, a dollar of carry is worth less than a dollar of FRE or SRE.
Following my model, I have tracked Apollo’s value quarterly. Here is the valuation table since the merger with Athene.

10-15x multiples for SRE and 20-25x multiples for FRE are my guesswork based on comps and certain assumptions. They are aggressive for SRE and modest for FRE compared with other analysts. However, I have never liked that these multiples are rather arbitrary.
Apollo plans to grow SRE at 10% and FRE at 20% for the next 5 years, according to its Investor Day presentation. We can forecast the present value of APO based on these numbers and assuming no buybacks. The latter assumption may be conservative. Apollo will have firepower for buybacks in years with strong results from its PII segment. Nevertheless:

At the midpoint, Apollo’s value will be ~$235. Discounting it at 10% to the present value produces ~$153 vs the current price of $133.
Let us now use a different method to determine Apollo’s intrinsic value without being overly conservative. Once this number is calculated, we can apply a margin of safety to guide our purchasing decisions.